netdata is a extremely optimized Linux utility that provides real-time (per second) performance monitoring for Linux systems, applications, SNMP devices, etc. and shows full interactive charts that absolutely render all collected values over the web browser to analyze them.
It has been developed to be installed on each Linux system, without interrupting the current running application on it. You can use this tool to monitor and get overview of what is happening in real-time and what just happened, on your Linux systems and applications.
This is what it monitors:
- Total and Per Core CPU usage, interrupts, softirqs and frequency.
- Total Memory, RAM, Swap and Kernel usage.
- Disk I/O (per disk: bandwidth, operations, backlog, utilization, etc).
- Monitors Network interfaces including: bandwidth, packets, errors, drops, etc).
- Monitors Netfilter / iptables Linux firewall connections, events, errors, etc.
- Processes (running, blocked, forks, active, etc).
- System Applications with the process tree (CPU, memory, swap, disk reads/writes, threads, etc).
- Apache and Nginx Status monitoring with mod_status.
- MySQL database monitoring: queries, updates, locks, issues, threads, etc.
- Postfix email server message queue.
- Squid proxy server bandwidth and requests monitoring.
- Hardware sensors (temperature, voltage, fans, power, humidity, etc).
- SNMP devices.
netdata Installation on Linux Systems
1. Before you start installing netdata utility, make sure you have these basic build environment packages installed on the system, if not install it using your respective distribution package manager as shown:
On Debian / Ubuntu
On Centos / Redhat / Fedora
2. Next, clone the netdata repository from git and run netdata installer script to build it.
Note: The
netdata-installer.sh script will build netdata and install it on your Linux system.
Once the netdata installer finishes, the file
/etc/netdata/netdata.conf will be created in your system.
3. Now it’s time to start netdata by executing the following command from the terminal.
You can also stop netdata by terminating it’s process with killall command as shown.
Note: Netdata saves on exit its round robbin database information under
/var/cache/netdata file, so that when you start again netdata, it will continue from where it was stopped last time.Starting and Testing netdata
4. Now open your browser and navigate to the following address to access the web site for all graphs:
Check out the video that shows how Real-time Linux performance monitoring done here:https://www.youtube.com/watch?v=QIZXS8A4BvI
netdata – Linux Real Time Performance Monitoring
5. You can also view the running configuration of netdata at any time, by going to:
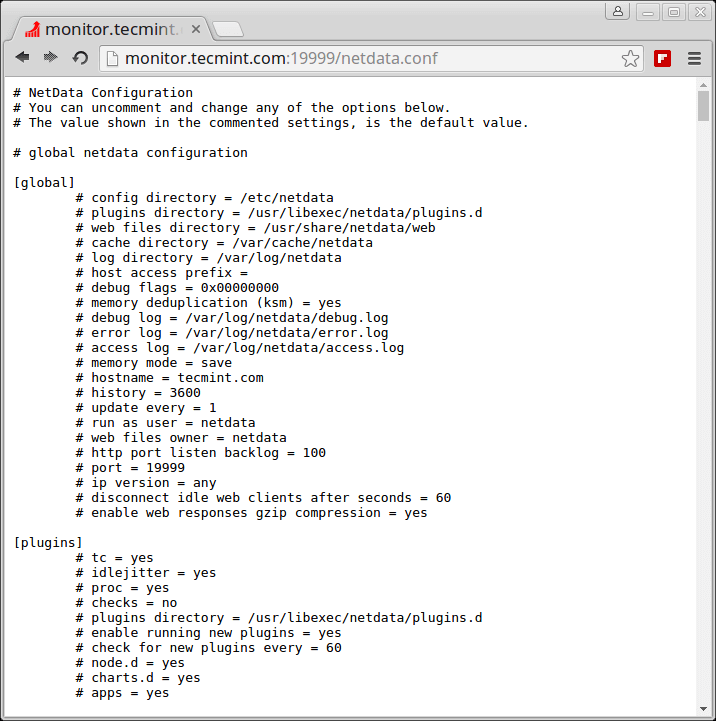
netdata Configuration
Updating netdata
6. You can update netdata daemon to the most recent version by going into
netdata.git directory you downloaded before and running:
The above netdata installer script will build new version and restart netdata.
Reference: https://github.com/firehol/netdata/